Analysis on Housing Environment And Children's Lead Exposure
NYU Big Data Team Project: Exploring the Relationship Between Housing Environment and Children’s Lead Exposure
You can see our whole code and final paper here
Why I and my teammate chose this topic?
New York has a rich history of development, but in the past, people were unaware of the harmful effects of lead. As a result, lead was commonly used in materials such as pipelines, house paint, and walls. As society became more aware of the dangers of lead, it has become a major issue, particularly for children. Lead exposure can be especially damaging to children as it can harm their brain and nervous system, slow their growth and development, and cause behavioral, hearing, and speech problems (CDC, 2022).
Lead exposure is a significant problem in developing countries, but it is also a problem in the USA. Many children continue to suffer from lead exposure, and various actions are being taken to address the issue in New York. As a result, my teammate and I have decided to analyze this issue to provide better insights for prevention campaigns or projects aimed at reducing children’s exposure to lead.
Project Stages
Project Proposal
After my teammate and I decided on our project topic, we both conducted research to gather data for analysis. We began by looking for related papers to ensure that our project was on the right track. We assumed that there must be a relationship between housing conditions and children’s blood lead levels and searched for related or similar studies on this issue. We found some research and confirmed that our project was indeed on the right track. Additionally, we noticed that some researchers claimed a relationship between socioeconomic status and children’s lead exposure. Therefore, we also considered the relationship between economic factors and lead exposure for potential analysis.
Next, we both searched for datasets to analyze. We aimed to obtain datasets from government websites for their reliability and the large number of available datasets. Therefore, we gathered all the datasets we needed from New York State Government websites. We each developed a workflow for analyzing each dataset, ensuring that we were covering all aspects of the project.
You can see our project proposal here.
Analysis
After we set our goal and found datasets, we conducted our analysis based on this workflow:
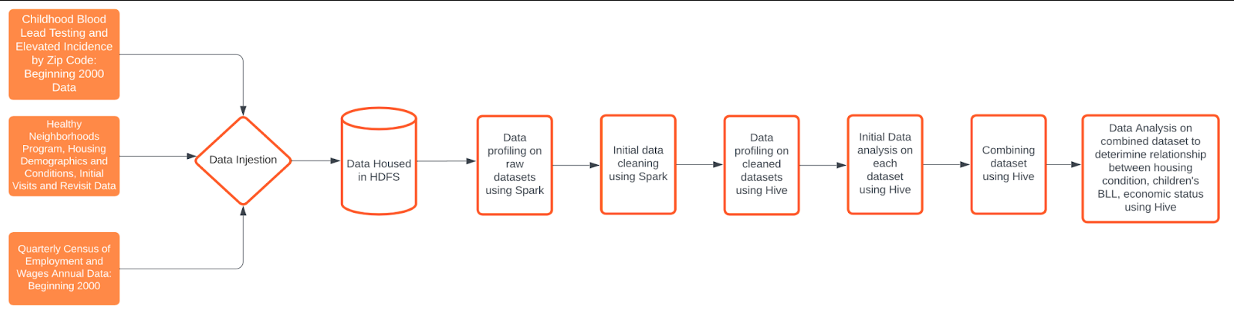
After gathering the required datasets, we stored them into Hadoop Distributed File System (HDFS) and performed data profiling on the raw datasets using Apache Spark. This helped us to understand the numeric and categorical values of our datasets. Based on the result of our data profiling on the raw datasets, we cleaned our datasets using Spark and then saved them as an external table into Apache Hive. We then did analysis on each dataset and combined datasets as necessary. During our analysis, we noticed that our housing condition dataset was limited, containing data for only 18 counties of New York State. To overcome this limitation, we added a new dataset that contained economic status for each county and performed further analysis. Finally, we used Tableau for data visualization, which helped us to better understand the trends and patterns in our data.
You can see our detailed work flow jobs here.
Here is our data visualization results and our analysis:
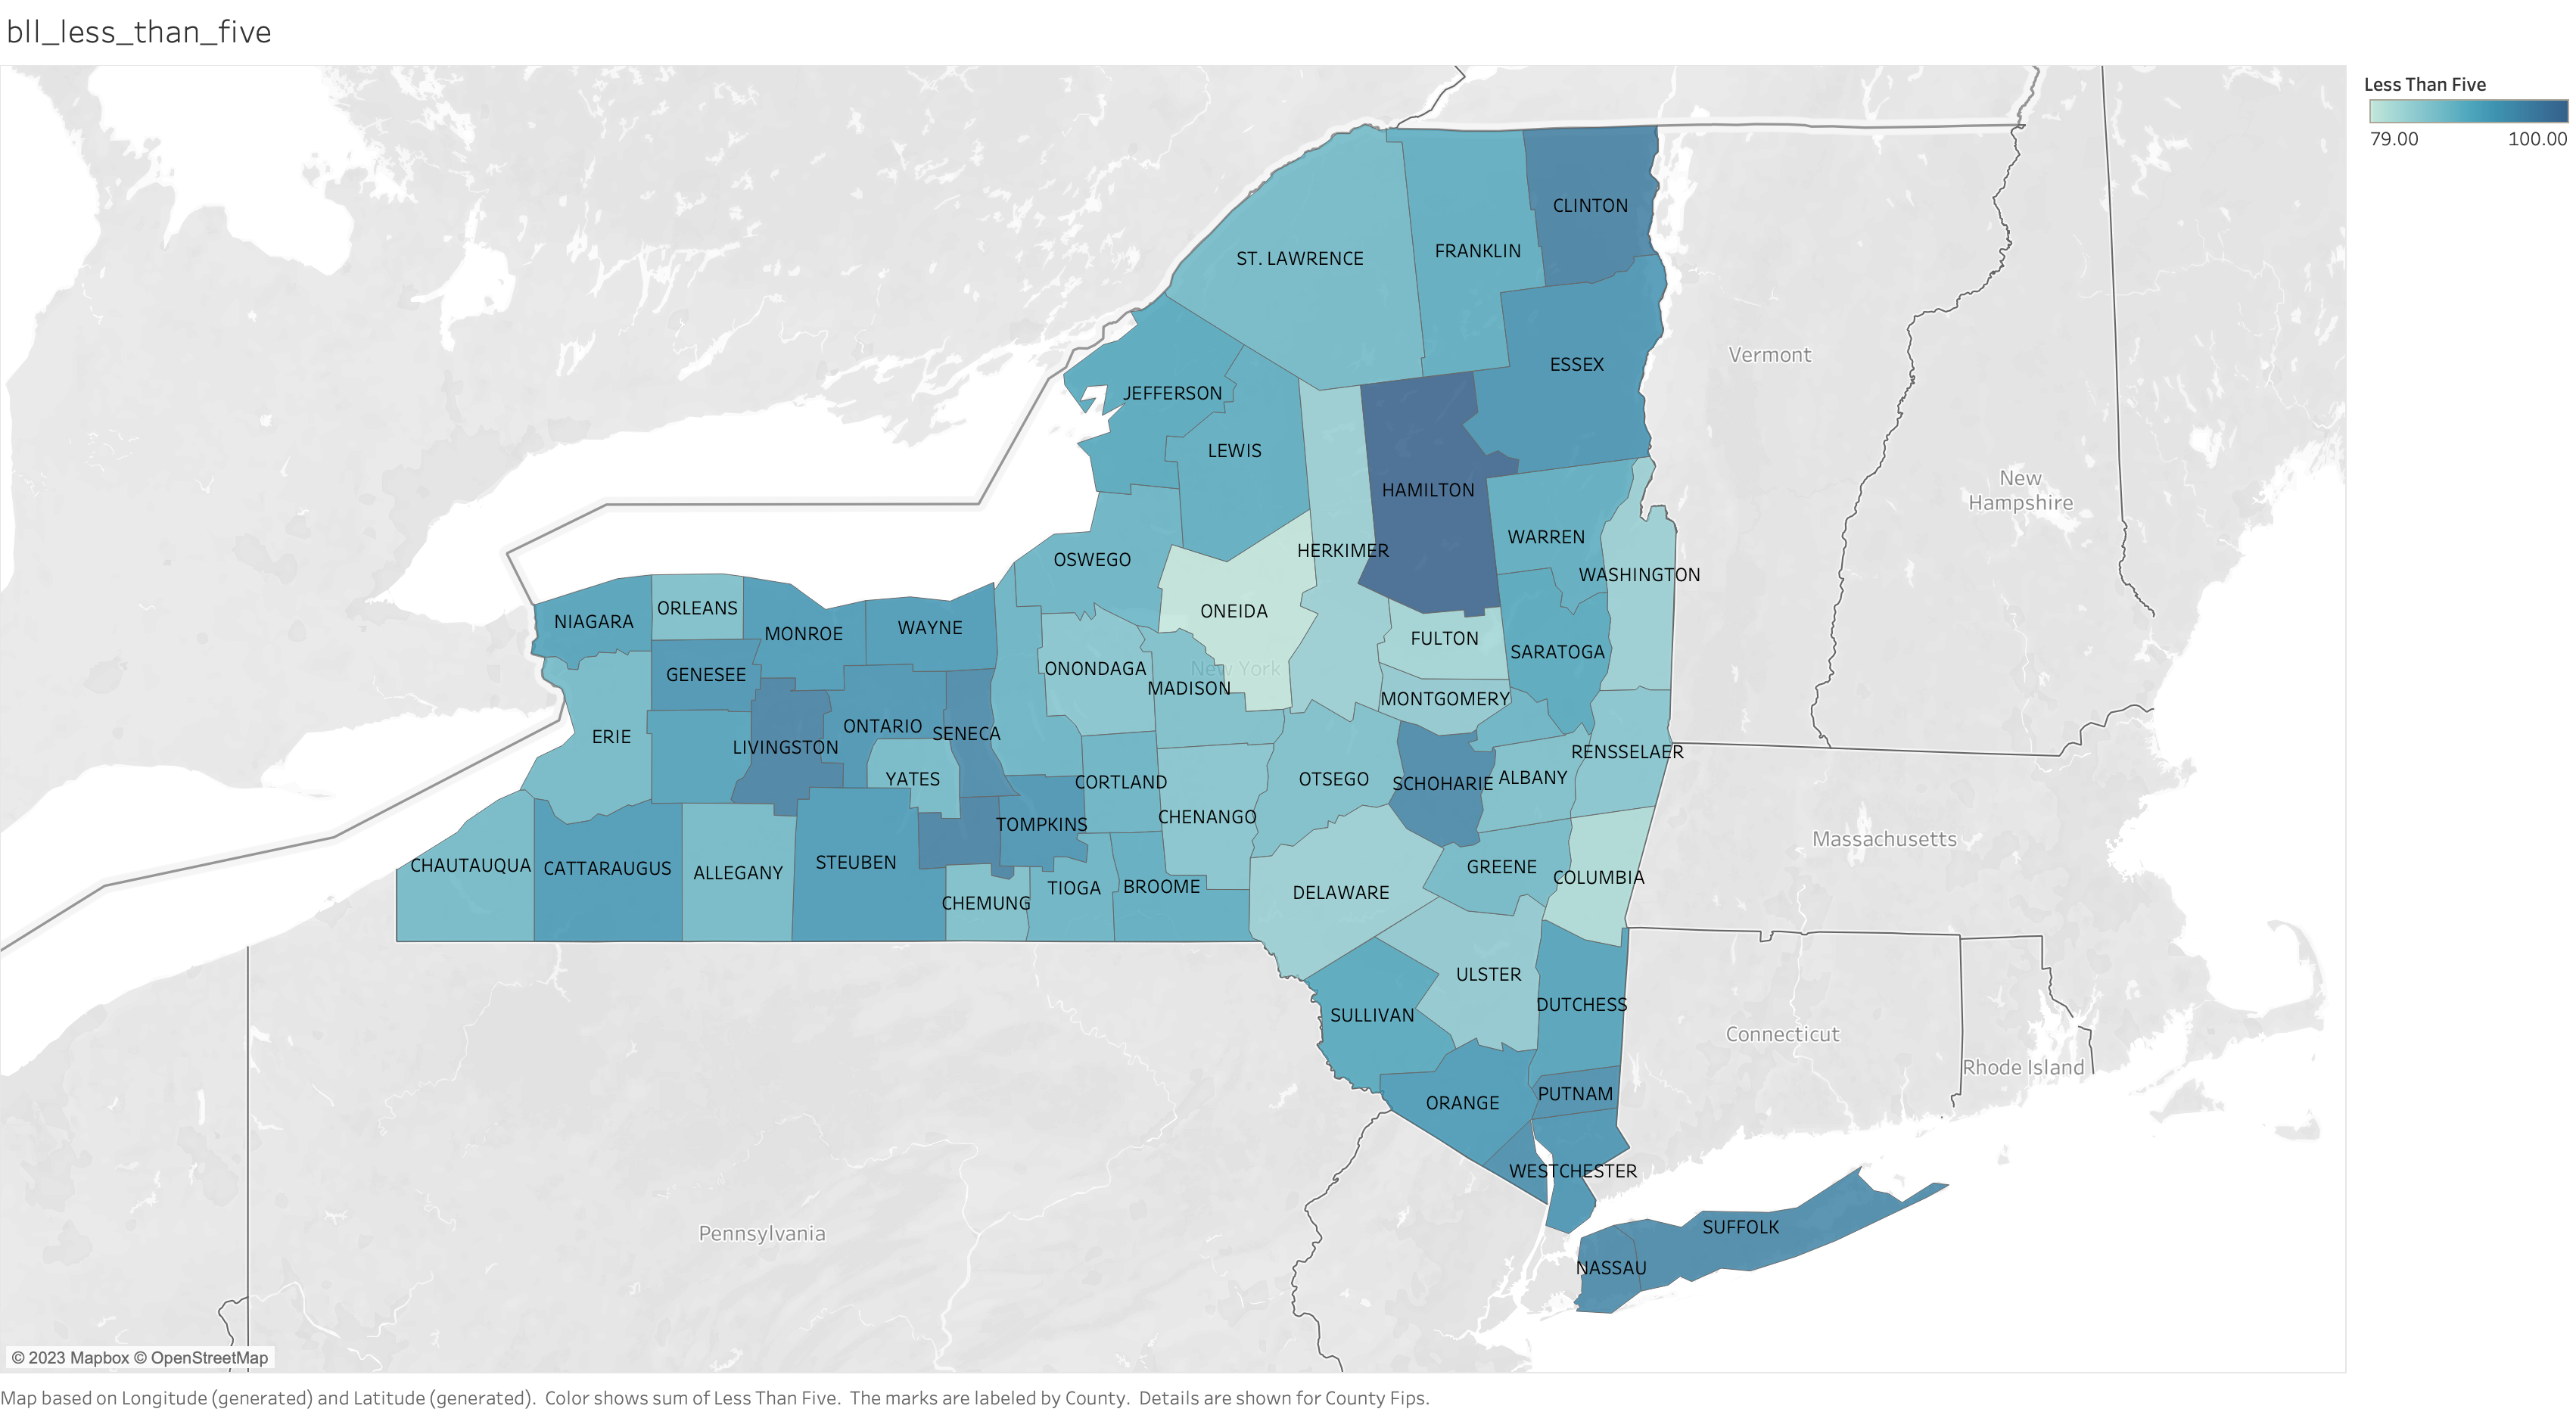
This is a visualization of the number of children with low blood lead levels in each county. We observed a weak trend, but it still appeared that children who live closer to the New York City area tended to have lower blood lead levels compared to those who live upstate. Hamilton County had the lowest average blood lead level among the counties analyzed. However, counties located near the New York City area, such as Westchester, Rockland, Nassau, and Suffolk, tended to show lower children blood lead levels among.
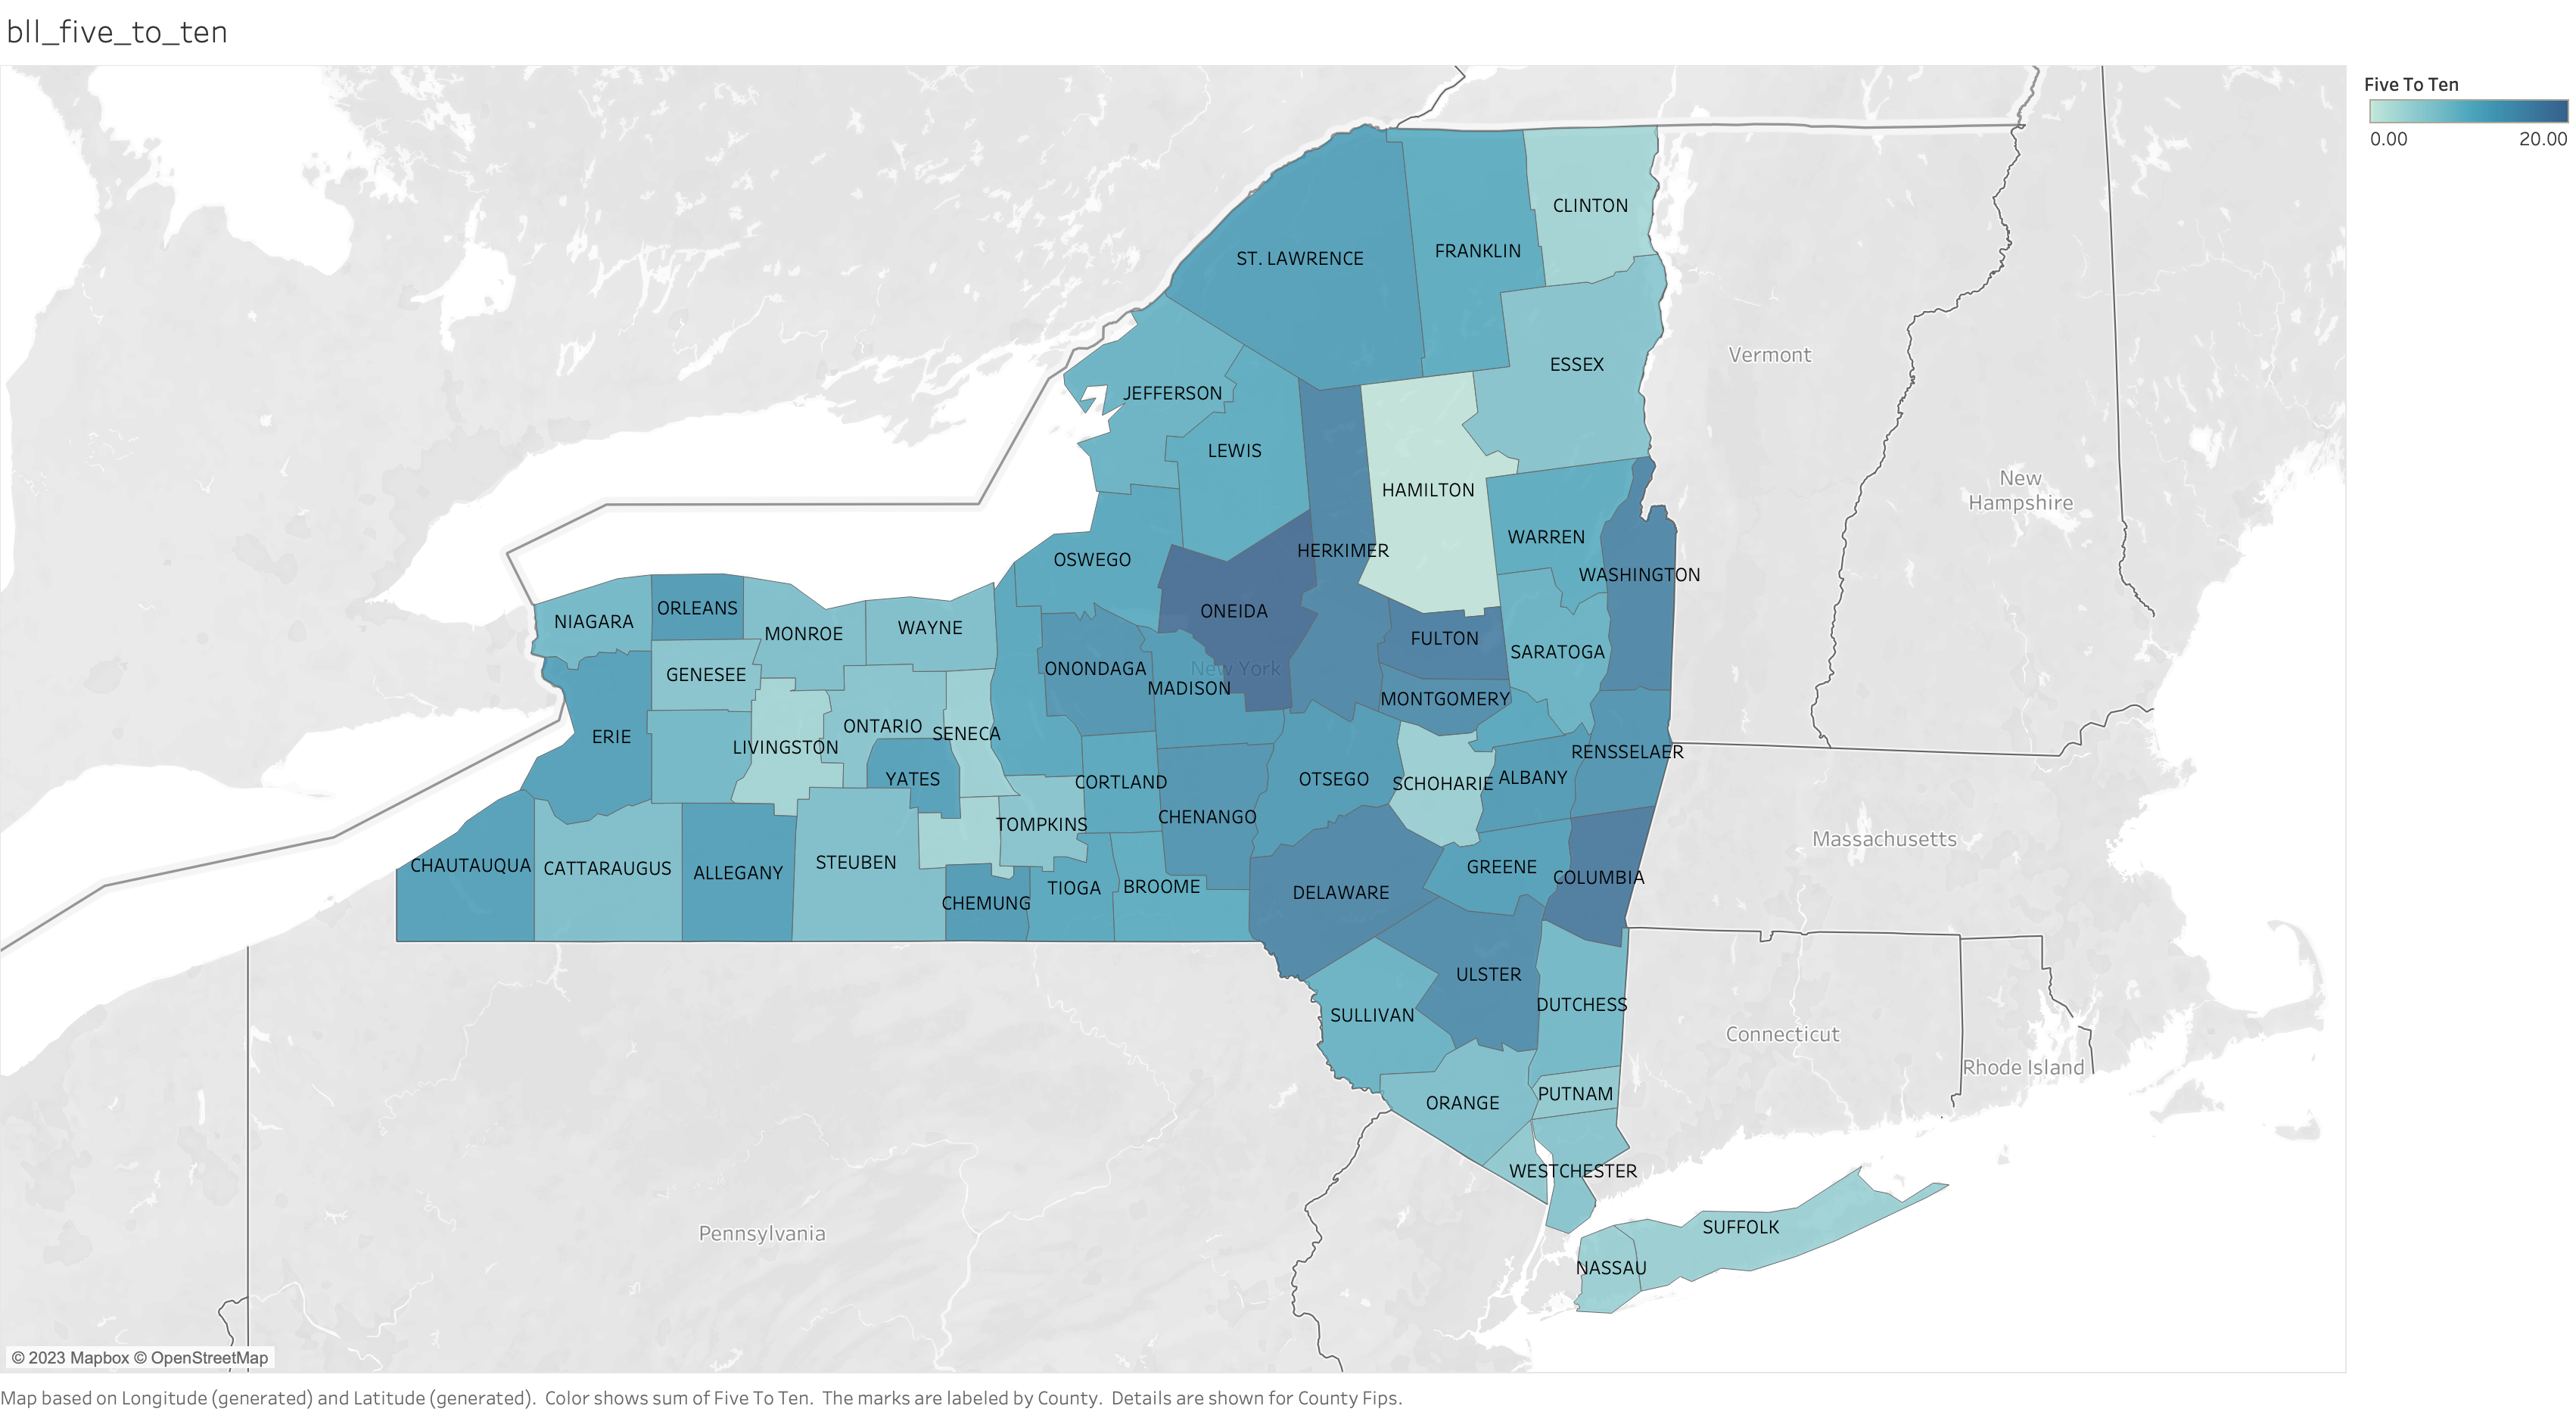
This is a visualization of the number of children with elevated blood lead levels in each County. Based on this visualization, we noticed that Oneida, Fulton, and Columbia were the counties with the highest number of children with elevated blood lead levels. In contrast, Hamilton, Schoharie, Livingston, and Seneca were the counties with the lower number of children with elevated blood lead levels. Additionally, we observed that children’s blood lead levels tended to increase as we moved farther from New York State. However, there was an interesting pattern where the levels decreased as we moved west, only to increase again afterwards.
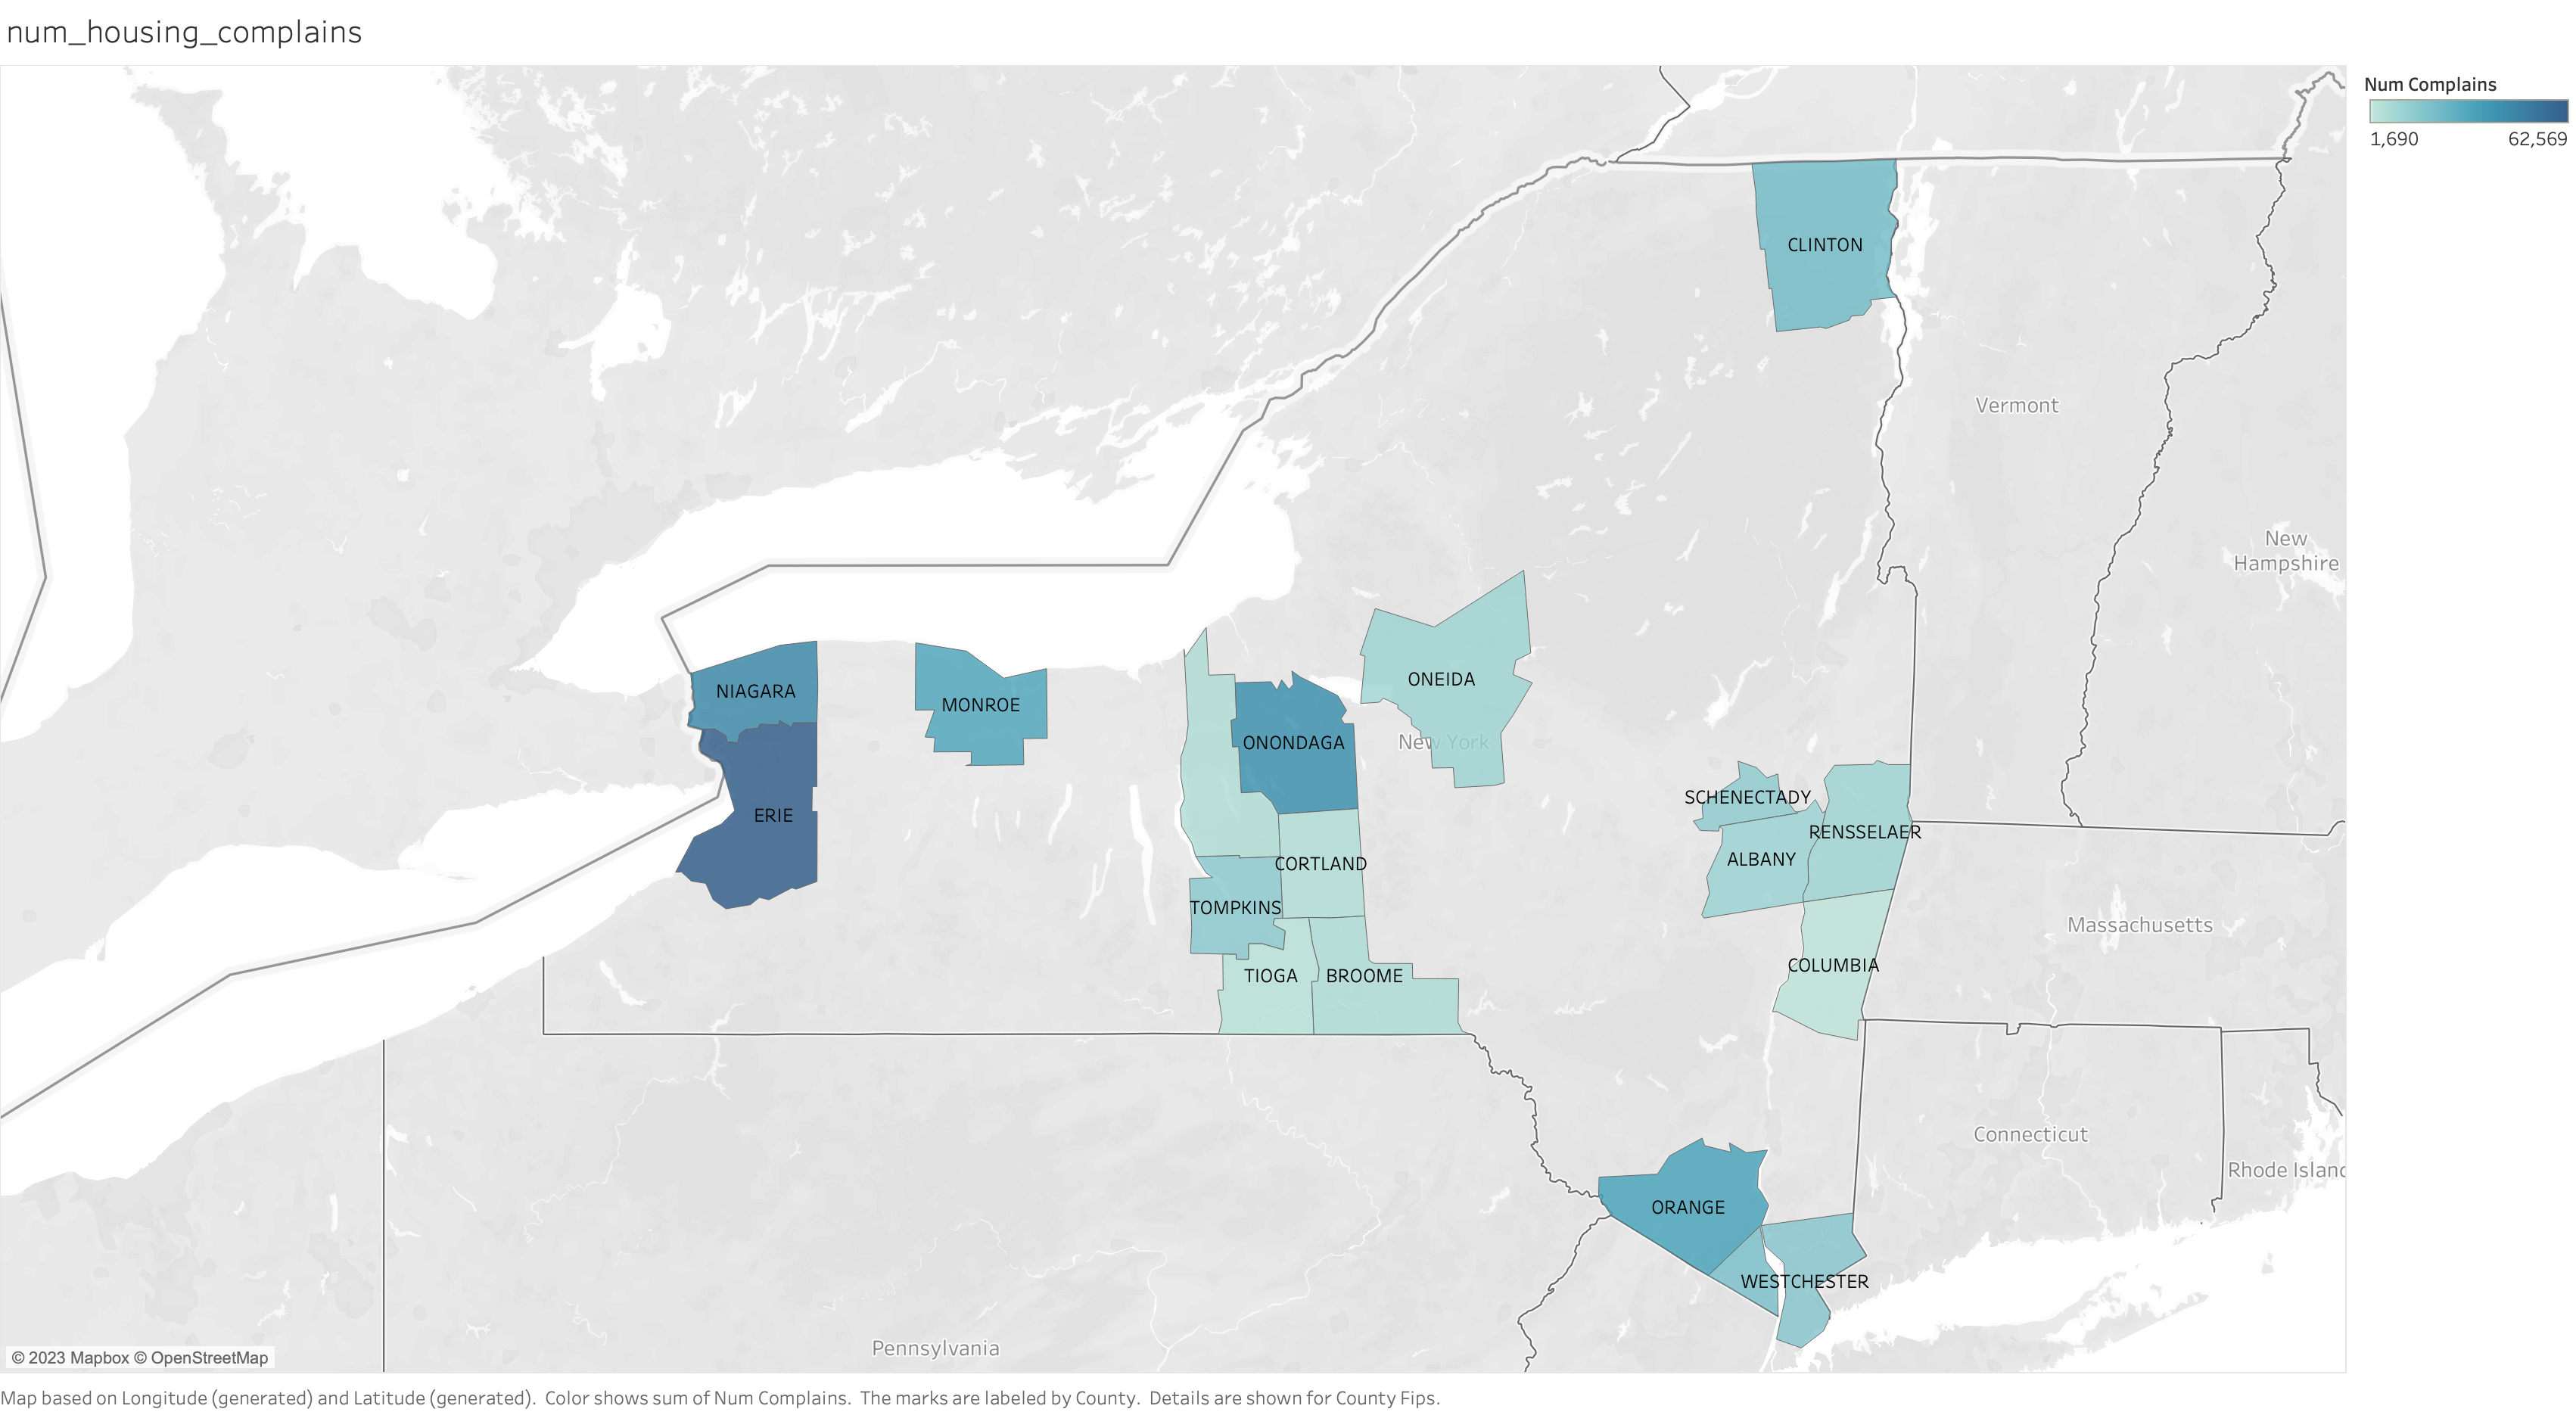
This is a visualization for the frequency counts of housing complaints related to conditions that can lead to lead exposure in each county. As you can see, we only got few counties from whole New York State. Based on this visualization, we noticed that Erie had the highest number of complaints that were associated with lead exposure conditions like Deteriorated paint inside and Deteriorated paint outside. Following Erie, Onondaga and Niagara were the counties with the highest number of complaints as well.
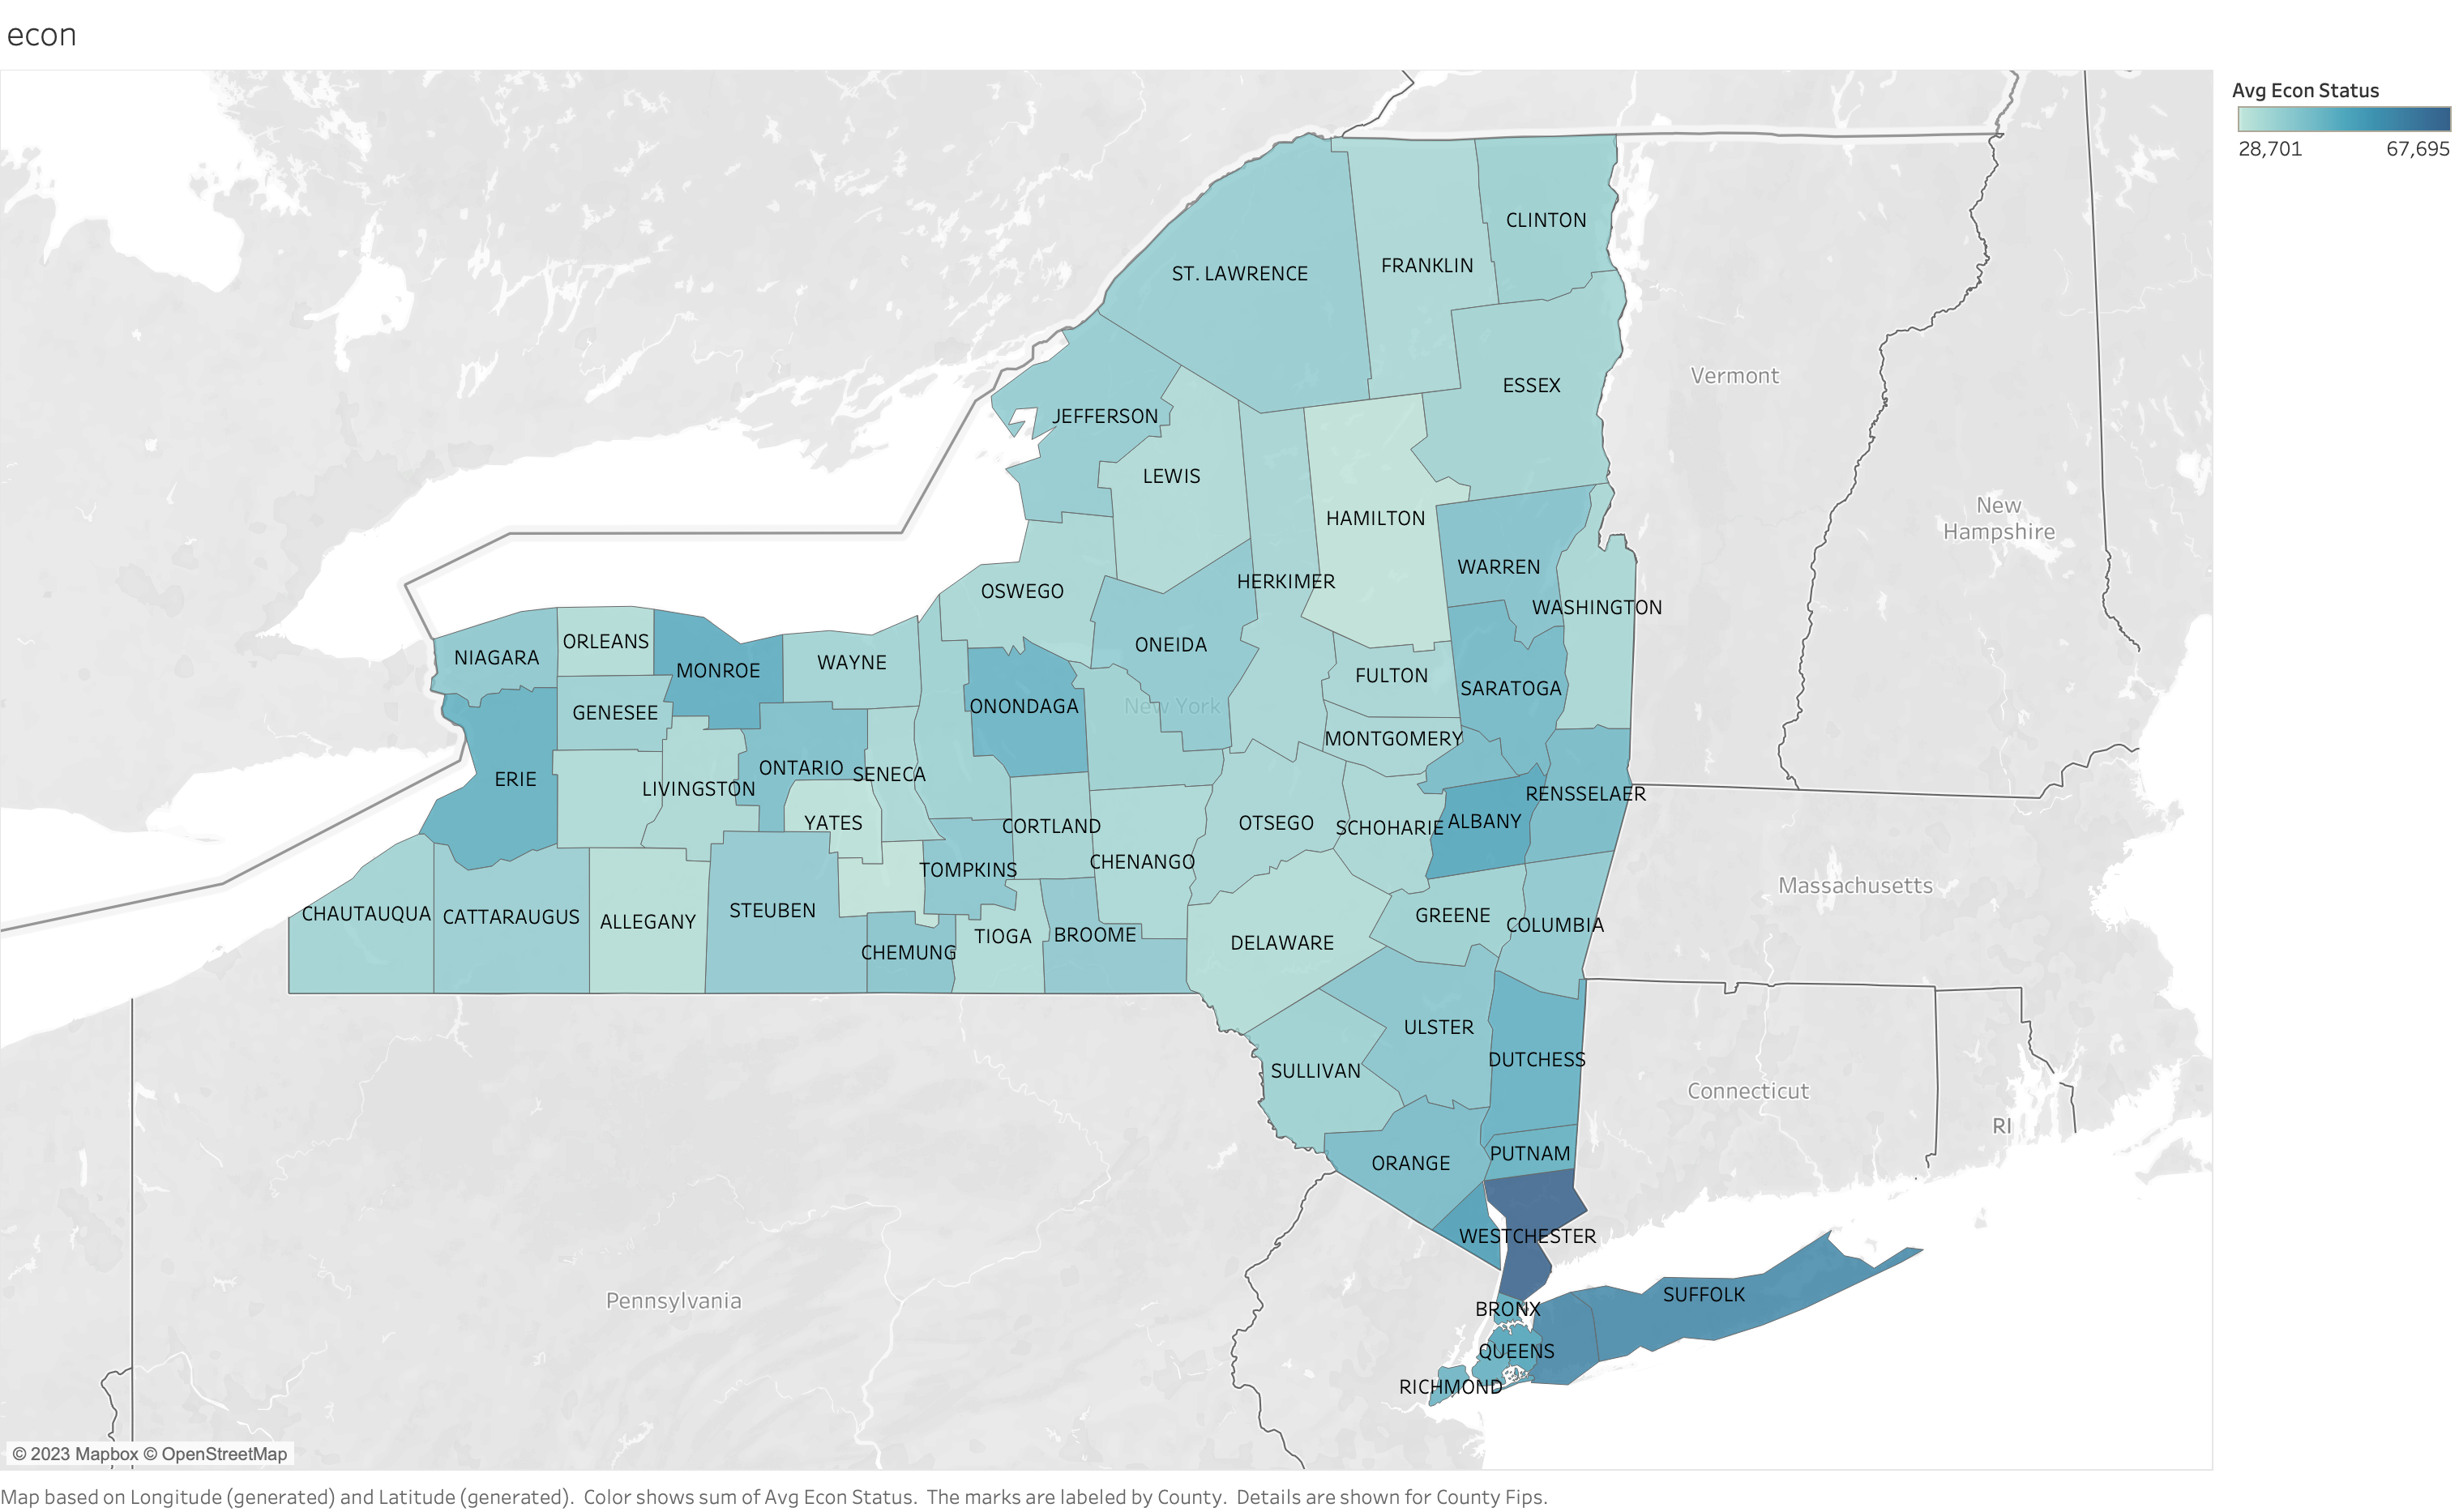
This is a visualization of the average annual wages for each new york state counties. The data shows that people who live closer to the New York City Area tend to have a higher economic status compared to those living in upstate. We observed a weak but somewhat relationship between children’s blood lead levels and economic status - when the economic status is higher, the children’s blood lead levels tend to be lower, and vice versa.
To show the exact numeric order, we utilized window functions and the RANK() function to generate a table with a unique rank assigned to each county based on their values for each column. This allowed us to avoid rough estimations. In addition to this, this provides a precise ranking order for the data and allows us to do statistical analysis based on their ranking.
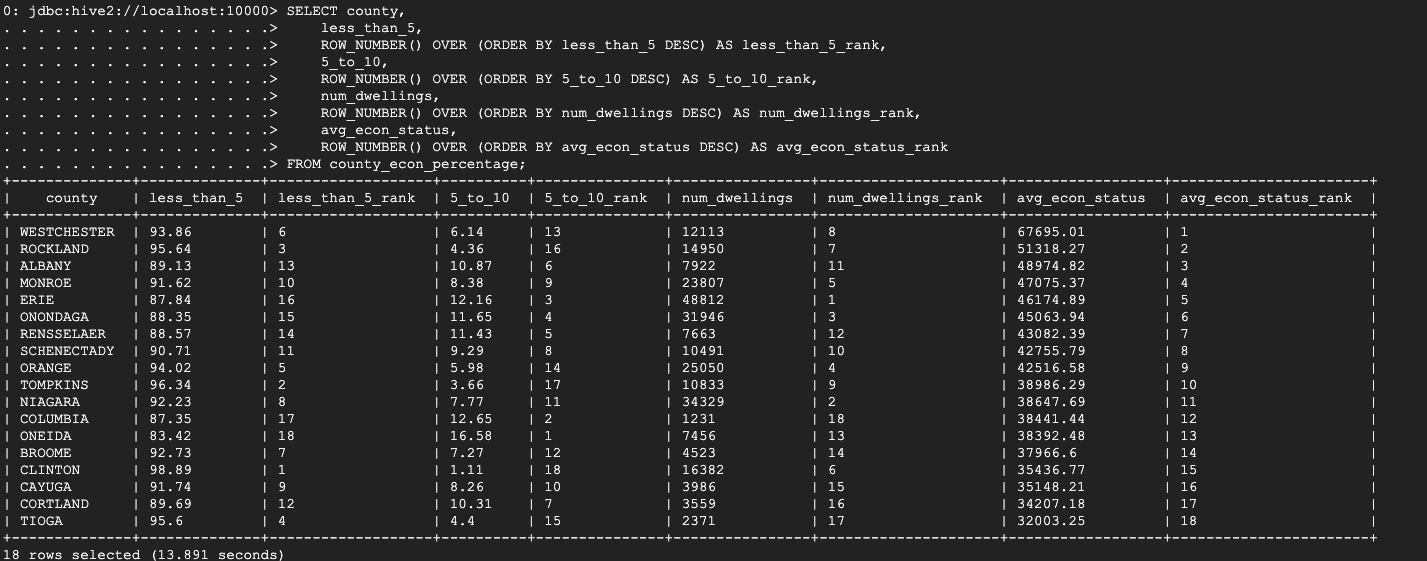
Based on the table, we can see that the top three counties with the lowest children’s blood lead levels are Clinton, Tompkins, and Rockland, while the bottom three counties with the highest children’s blood lead levels are Oneida, Columbia, and Erie. Additionally, we can see that the top three counties with the highest number of housing condition complaints related to lead issues are Erie, Niagara, and Onondaga, while the bottom three counties with the lowest number of housing condition complaints are Cortland, Tioga, and Oneida.
It is important to note that not all counties exhibit the same trend, but there does seem to be a correlation between higher numbers of housing condition complaints related to lead issues and higher children’s blood lead levels in some counties, such as Erie.
Westchester, Rockland, and Albany are among the top counties with higher economic status, while Cayuga, Cortland, and Tioga are among the counties with lower economic status. However, there appears to be no clear relationship between economic status and the number of housing complaints related to lead issues.
Conclusion
We did not find exact numeric relatinoship or correlation between housing conditions and both ranges of blood lead levels in children, or between housing conditions and economics. However, our visual diagrams revealed some patterns and relationships worth noting.
Based on our observations from figures for children blood lead level and economic status, counties located near the New York City area tended to have higher economic status and a larger proportion of children with low blood lead levels compared to elevated blood lead levels. This finding suggests that economic status could potentially play a role in a child’s risk of lead exposure. Additionally, when examining the county rankings in table above it, we found that Erie County was among the top three counties with the highest number of children with elevated blood lead levels, as well as one of the top three counties with the most housing condition complaints related to lead issues. This observation indicates a potential relationship between lead exposure and poor housing conditions.
However, it is important to note that our housing conditions dataset did not include data for all counties in New York State, leading to a loss of data during the join process. This could have affected our results and led to the low correlation and negligible correlations obtained. In future research, it would be beneficial to explore alternative housing condition datasets that include data for all counties to retain complete data. While the Children Blood Lead Levels and Annual Average Salary datasets did have data for all counties in New York State, we still lost data when joining all three datasets on the county column.
Symposium
We presented our project and analysis to our classmates, sharing our findings and results, and also listened to their analysis and results.
You can see our slide for symposium here.
Paper
We wrote a paper based on the results of our analysis.
You can see our final paper here.
References
Centers for Disease Control and Prevention. (2022, October 24). Prevent children’s exposure to lead. Centers for Disease Control and Prevention. Retrieved May 6, 2023, from https://www.cdc.gov/nceh/features/leadpoisoning/index.html#:~:text=windowsills%2C%20and%20wells.-,Exposure%20to%20lead%20can%20seriously%20harm%20a%20child’s%20health%2C%20including,and%20hearing%20and%20speech%20problems.