Machine Learning Project with Orbital Insight
Before We Start Talking about the Project…
This Machine Learning Project was a part of the Break Through Tech AI Program hosted by Cornell Tech. It was a one-semester program (Fall 2022), and in this project, I worked in a team of four students with the company “Orbital Insight.” I will talk about this in more detail later.
This was my **first** machine learning project and also my first group project. Not only that, but while doing this project, I noticed that I really enjoy analyzing data. It’s always fun to visualize the data and the most interesting part of it is pulling out meaningful insights from the massive data. Therefore, before this project, I really did not know what kind of software developer I wanted to be. My major is computer science, and I kind of like studying the mathematical part of computer science, but whenever I studied other software engineering fields such as web/app development, computer graphics, parallel computing, and so on, I never really “clicked” with those fields. However, data analysis and all ML/AL studying were different. When I first started learning this field, I noticed that
“Wow, this is my field.”
It’s a little bit late (since I am already a senior now), but I always think it’s better to notice it now and start doing something about it. And I started doing what I can do right now. I got a machine learning specialist position at NYU VIP Team - AI for Scientific Research - and will work on a project from this spring semester and joined several programs. I might apply for an on-campus ML engineer job and hopefully, I can work there.
Anyway, during the fall 2022 semester, many things impacted and changed me. This project was one of the factors that changed me a lot.
Team Orbital Insight: The Effect of Typhoons on Shanghai Shipments
Orbital Insight is a *geospatial analytics* company. They analyze all kinds of geospatial data such as satellite, drone, plane, vessel, vehicle, and cell phone signal data to find out business and other strategic insights. In our project, our team decided to analyze vessel data and built a model that can predict "**dwell times**" of ships during and outside of the typhoon season, specifically in the Shanghai area.
Group Work Experience
This was a team-based project, so our challenges were not only building our ML model successfully, but also achieving other “soft skills” like communication, time management, collaboration, leadership, and so on.
Communication with Challenge Advisor and AI Studio TA
Mostly, our team communicated with our challenge advisors and AI Studio TA through Slack. Whenever we had obstacles in our project, we asked for help from our advisor and she always connected us to various data scientists at Orbital Insight. By discussing and solving obstacles together with currently working data scientists, we were able to approach our project in a more professional way and think in many different ways. This experience taught me how to work with other data scientists and to ask for help whenever we encountered technical issues or obstacles.
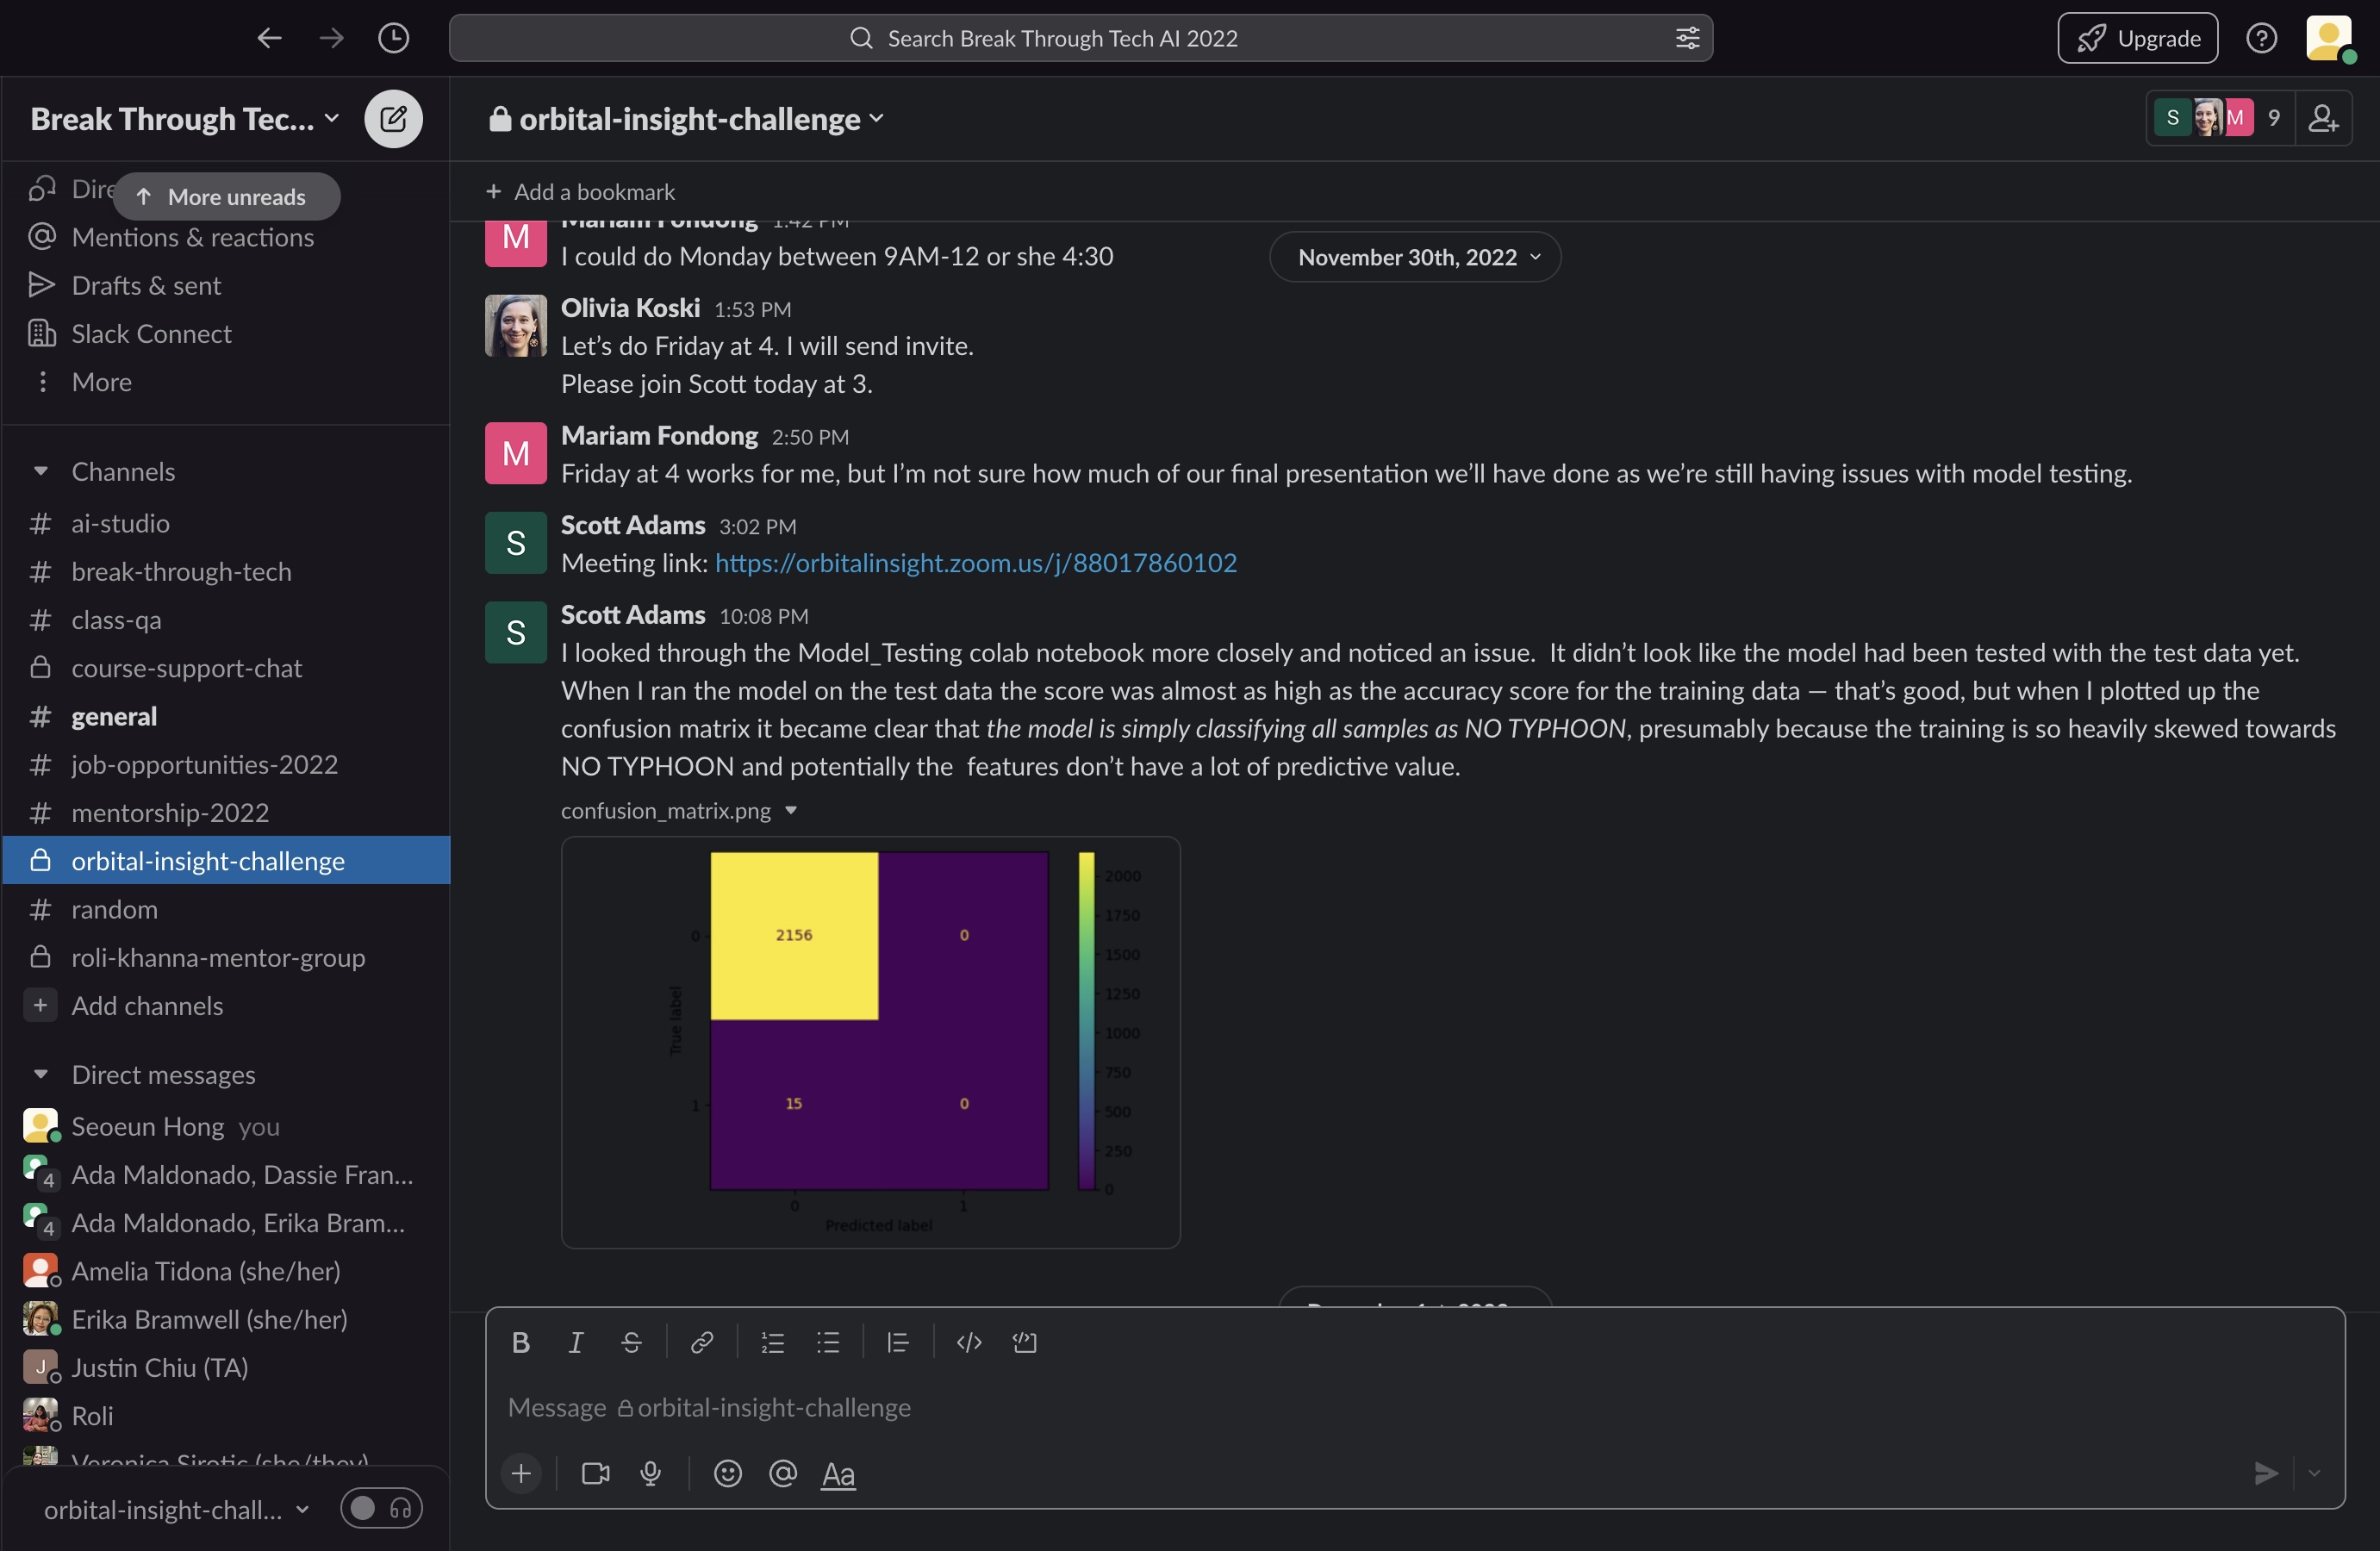
This is part of our slack messages with our challenge advisor and data scientist of Orbital Insight
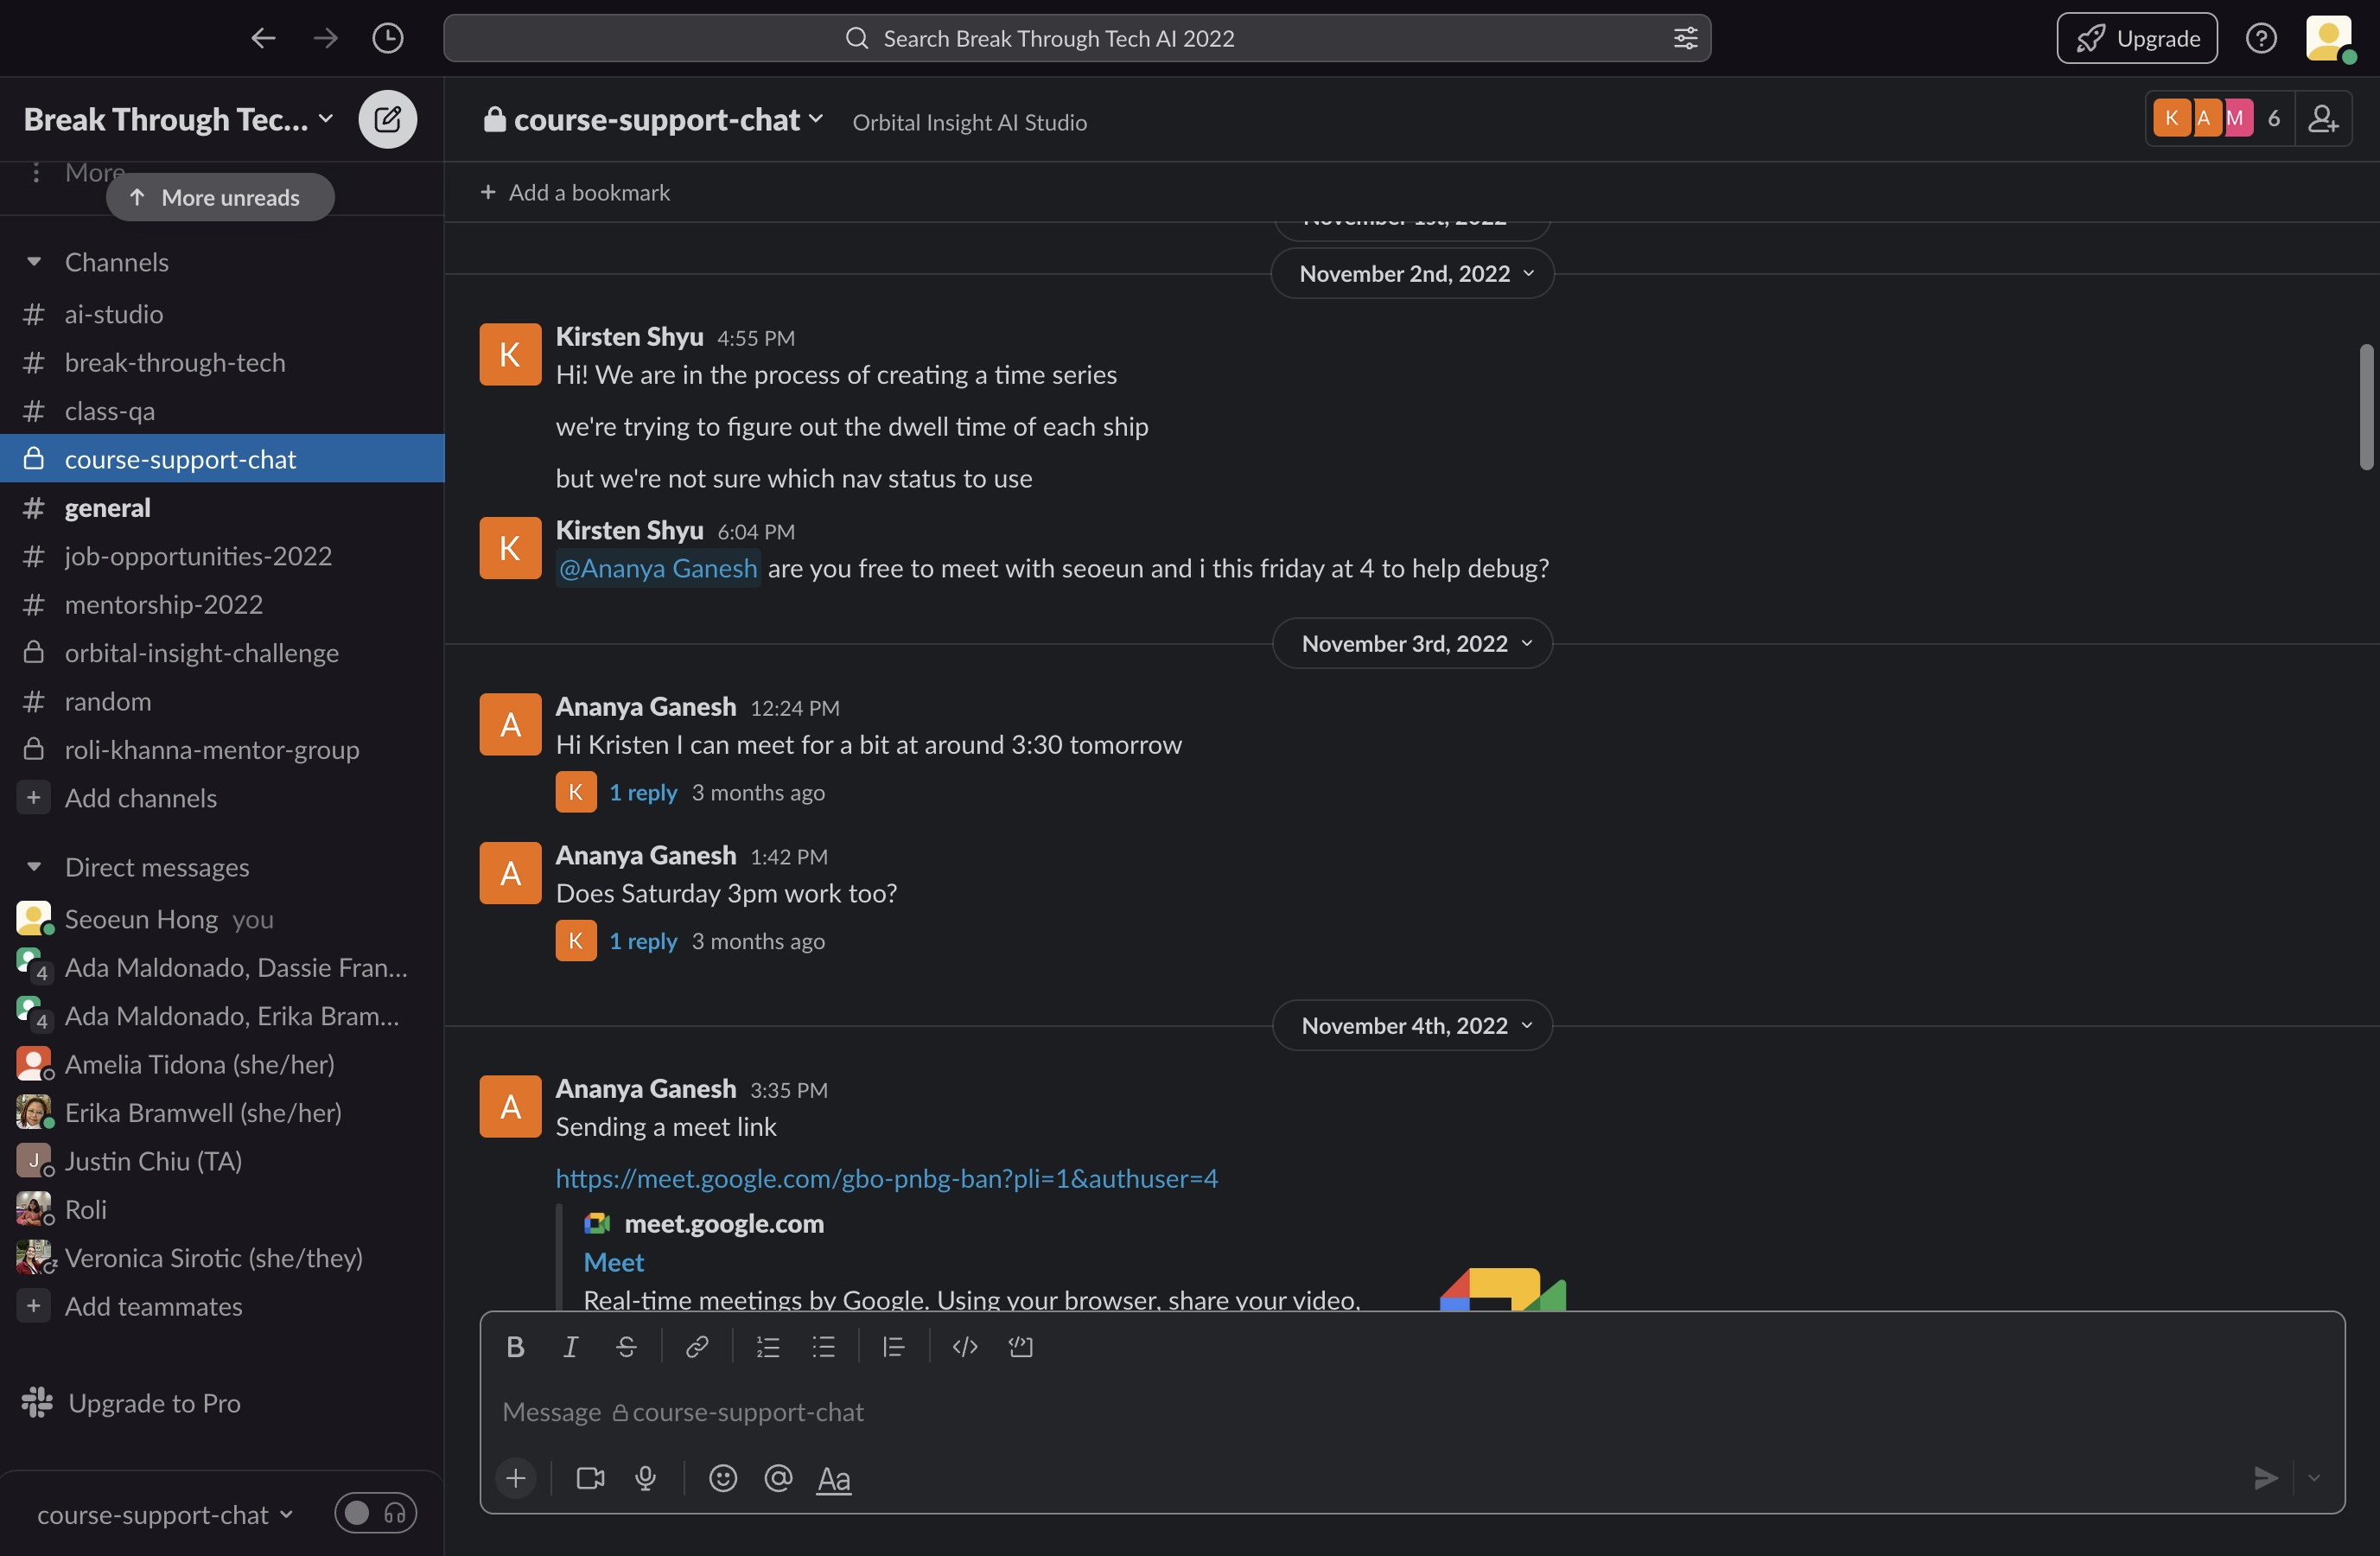
This is part of our slack messages also with our TA
We did not have a specific place and time to work together. Therefore, we always checked time availability using “When2meet” and mostly met on Zoom (or google meeting). Sometimes, we could have meetings at the Orbital Insight office.
This is Orbital Insight’s Office photo!

Team Communication and Workload
Our team also started communicating using Slack. However, we had a little bit of trouble communicating using Slack, so after half of our project, we switched our communication platform to text messaging.
Even though we did not have a physical space to work together, we tried to meet in person and work together. Whenever we needed to meet *in person*, we met at a public library. However, towards the end of the semester, it was a bit difficult to meet each other, so we mainly met through Zoom.
We did not divide our workload strictly. Sometimes we did, but *mostly we worked all together at the same time*. This may appear to be inefficient, but the advantages of this method were: first, everyone could be on the same pace and there was no one who fell behind. Second, whenever there were obstacles and challenges, we could discuss them right then and solve them together. This actually reduced the amount of time we spent on our project.
Industrial Scale Project Experience
This project let me experience a “real-world” problem. From choosing the topic to finding a solution, all steps were different from what I’ve experienced so far. In the past, the topic was already given and there was always an “ideal way” to solve the problems. The data was also neat. However, in this project, every step needed to be discussed and thought about critically. For example, when we chose the topic, we needed to rethink whether or not the topic was feasible.
Our team was lost at first because none of us knew what to do, but we managed well after.
About the Project
This project description is based on our team’s final presentation slide and plus my own detail description on data preprocessing. Our team presented the project results in front of 20+ professional people from Orbital Insight and Cornell Tech.
This is the link of our final presentation video:
https://youtu.be/bGd3z2A_Sko
AI Studio Project Overview
Team Challenge Goal
To build and test a model that will accurately predit dwell times of ships heading to Shanghai during and outside of typhoon season
What is dwell time? Time spent in same position, area, stage of process
Business Impact
Why we chose this goal?
Merchants and businesses need to know when shipments arrive
- Shanghai is one of the busiest ports in the world
- Delays here impact the global supply chain, making this important to understand
- Ship dwell times are difficult to predict in typhoon-affected waters
- See the effect that worsening typhoons (caused by climate change) could have on shipping
Utilize geo-spatial data rather than typical dataset, AOI (drawing polygons, QGIST)
Important economic impact, provides insight to businesses that can only be drived from AI

Our Approach
Resources we used for this project

At first, to decide our project topic and look around vessels’ activities, we used Orbital Insight’s own program “Orbital Insight Go”. Based on that, we asked Olivia to gather AIS data and used QGIST to visualize it.
To work on our project, we used Google Colab to collaborate with and used Pandas and Scikit-Learn for implementing data preprocessing and making a machine learning model.
Data Preprocessing and EDA
First of all, we had to deal with Null values, drop unnecessary values, and change String values to some dummy values.
1
df.drop("imo", axis = 1, inplace = True)
1
df.drop("vessel_name", axis = 1, inplace = True)
1
df.drop(df.loc[df['nav_status_code'] == 16].index, inplace=True)
1
2
3
df.drop(df.loc[df['length'] == 0].index, inplace=True)
df.drop(df.loc[df['width'] == 0].index, inplace=True)
df.drop(df.loc[df['draught'] == 0].index, inplace=True)
First, we dropped the “imo” column. IMO stands for “IMO ship identification number” and this number is used as a unique ship identifier. However, in our data, there were many 0 values and we already had the “device_id” column for identifying unique ships, so we decided to drop it.
We also dropped the “vessel_name” column for the same reason. This column was a string value and we had to either drop it or change it to a dummy value, but we already had the "**device_id**" column that could be used instead of "vessel_name".
Next, we had to deal with “null values”. The first null values that we dealt with were “df[‘nav_status_code’] == 16”. “nav_status_code” means AIS Navigational Status and this is a form of signal reported by the vessel, which describes **the status of the vessel** in real-time. The codes have their own meanings from 0 to 15, but we noticed that some of our data had 16 as its value. After discussing with our advisor, we decided that this did not have any meaning, so we dropped the rows that had 16 as its “nav_status_code” value.
The next null values we had to take care of were “df[‘length’] == 0, df[‘width’] == 0, df[‘draught’] == 0”. The columns ‘length’, ‘width’, ‘draught’ do not have meaning separately, but if you multiply all of them (length x width x draught), it becomes “tonnage” (the capacity of the ships in tons, in our case, the vessel’s capacity under the water). To be valid vessel data, this "tonnage" value should be larger than 0, but if one of the values is 0, “tonnage” value becomes 0, so we decided to drop these values. The reason why we just dropped them rather than substituting with other values was the amount of data that had invalid values was way smaller than the original value. So, we decided to drop it considering our time constraints.
Next, we tried to calculate the tonnage of the vessel under the water (ocean) because we thought that the vessel’s tonnage under the ocean might have a connection with predicting the “dwell time” of the ships.
1
2
3
4
# Calculate Tonnage
df['tonnage'] = 0
df['tonnage'] = df['length'] * df['width'] * df['draught']
df = df[df['tonnage'].notna()]
Now, using the “unixtime” of our AIS data, we first tried to prove our assumption that a *typhoon would affect a vessel's journey, especially the dwell time*. If there is a big difference before and after the typhoon period, we can say that a typhoon can affect a vessel's journey. Since we know that a typhoon can have a big impact on our vessel’s journey, it would also affect the vessel's dwell time. Therefore, when we make our model that can predict the “dwell time” of a ship, we can tell the model:
Oh, if vessels are doing a journey when a typhoon happens, the dwell time would be different than normal time. The vessels’ dwell time during the typhoon season are like this. Please be aware of this when you calculate the dwell time.
This was our plan, so now let’s begin with data analysis.
We converted “unixtime” to “datetime” for our better understanding.
1
2
3
# Convert Unixtime
df['unix_to_date'] = 0
df['unix_to_date'] = pd.to_datetime(df['unixtime'], unit='s').apply(lambda x: x.to_datetime64())
And then, among our AIS data, we grabbed “df[‘nav_status_code’] == 1”. As I mentioned before, we want to check whether or not a typhoon would affect a vessel’s journey, especially the dwell time. There must be a fewer number of “anchored” vessels before the typhoon and an unusual huge number of “anchored” vessels after the typhoon if a typhoon really “affects” a vessel’s journey. Therefore, to only get anchored ships, we only have to get the “anchored” vessel’s data and *"1" value for "nav_status_code" means in AIS data means that the vessel is anchored*.
1
df_anchored = df[(df['nav_status_code']==1)].copy()
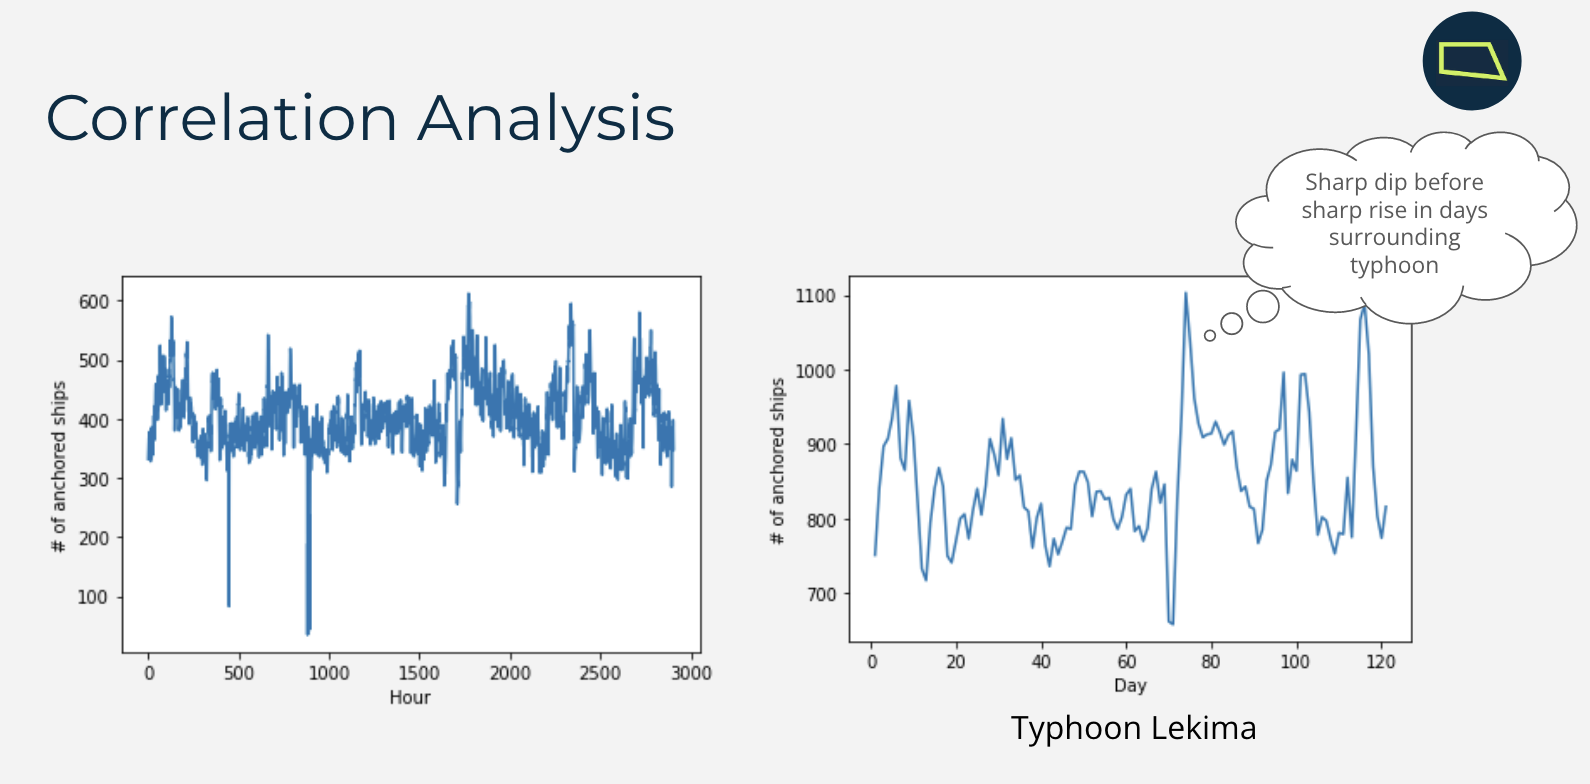
With this anchored vessel’s data, we tabulated unique vessels by hours and date to prove our assumption and it actually was true. Our data analysis shows that there is a huge difference in the number of vessels that are anchored at a port before and after a typhoon.
1
2
3
4
5
6
7
8
9
10
11
12
13
# Function we used for "tabulating" unique vessels by hours and date

def hourlyData(df):
    df['hour'] = (df['unixtime'] / 3600).astype(int)
    # re-index hours to 1
    df['hour'] = df['hour'] - df['hour'].min() + 1
    return df.groupby('hour')['device_id'].agg('nunique')

  def dailyData(df):
    df['day'] = (df['unixtime'] / 86400).astype(int)
    # re-index hours to 1
    df['day'] = df['day'] - df['day'].min() + 1
    return df.groupby('day')['device_id'].agg('nunique')
1
2
3
# tabulate unique ships by hour
hourly_anchored = hourlyData(df_anchored)
hourly_anchored
1
df_anchored['num_anchored_hour'] = df_anchored['hour'].apply(lambda x: hourly_anchored[x] if (x > 0) else 0)
1
2
3
#tabulate unique ships by day
daily_anchored = dailyData(df_anchored)
daily_anchored
1
df_anchored['num_anchored_day'] = df_anchored['day'].apply(lambda x: daily_anchored[x] if (x > 0) else 0)
This is correlation analysis of our data
After that, we started calculating the “dwell time” of the ships. This step was the hardest because **dwell time** is calculated by "**vessels leaving - vessels arriving**". It looks simple, but in our AIS data, some of the vessels had multiple trips. Therefore, we needed to differentiate between the **end of a first trip** and the **start of another trip**.
To differentiate the multiple trips, first, we got all the time data (‘hour’ columns in our dataset) of each unique vessel and sorted all the time by its value in ascending order. After that, if there was a **big time difference** between the trip, we **considered that as another trip** and saved it in a separate list to use it to get multiple dwell times.
How we differentiate multiple trips
1
2
3
4
5
6
7
8
9
10
11
12
13
14
15
16
17
18
19
# All anchored time for each unique ships
  current_time = sorted_anchored.loc[sorted_anchored['device_id'] == i][['hour']]
  array_hour = current_time.values.tolist()
  hour_len = len(array_hour)
  biggest_dif = 0
  # it contains index of list_hour(list unique ship's "hour" column) that seems to start new trips
  trip_change = [0]
  list_hours = []

  for x in array_hour:
    list_hours.append(x[0])

  for j in list_hours:
    next_index = list_hours.index(j) + 1
    if(next_index < hour_len):
      biggest_dif = list_hours[next_index] - j
    # This means this ships had done multiple trips
    if(biggest_dif > 12):
      trip_change.append(next_index)
Get the dwell time of the multiple trips
1
2
3
4
5
6
7
8
9
10
11
12
13
14
15
16
17
18
19
20
21
22
23
24
25
26
	dwell = []
  start_times = []

  for h in range(len(trip_change)):
    # This "if" condition for avoiding index range error
    if((len(array_hour) != trip_change[h])):
      # the case when there are only two different "trip changes"
      if(len(trip_change) == 2 and h == 1):
        dwell.append((list_hours[trip_change[h]-1] - list_hours[trip_change[h-1]]) + 1) #trip 1
        start_times.append(list_hours[trip_change[h-1]])

        dwell.append(list_hours[-1] - list_hours[trip_change[h]] + 1) #trip 2
        start_times.append(list_hours[trip_change[h]])

      #Last index
      elif(h + 1 == len(trip_change)):
        dwell.append(list_hours[-1] - list_hours[trip_change[h]] + 1)
        start_times.append(list_hours[trip_change[h]])

      # Other index
      elif (h != 0):
        dwell.append((list_hours[trip_change[h]-1] - list_hours[trip_change[h-1]]) + 1)
        start_times.append(list_hours[trip_change[h-1]])

  dwell_times[i] = dwell
  trip_start[i] = start_times
We got “dwell time” by using two data points. One for the “vessel arrival” time and one for the “vessel leave” time. And eventually, both indicate the same trip. Since our data is duplicated, if we keep both, we decided to keep the data for "vessel arrival" only and assigned the dwell time to that data.
1
2
3
4
5
6
7
8
9
10
11
12
13
14
15
16
17
18
19
20
new_sorted_anchored = sorted_anchored.copy()
# key == vessel's device id
dwell_times_keys = dwell_times.keys()
for i in dwell_times_keys:
  # Get all trips of one unique vessels
  target = sorted_anchored.loc[sorted_anchored['device_id'] == i]
  # Get the 'hour' data of that unique vessel
  target_hours = target['hour']
  hours_array = np.array(target_hours)
  for j in hours_array:
    # basically in our AIS data,
    if that hour is in "trip_start" column of that vessel, add "dwell time" column,
    # s
    if (j in trip_start[i]):
      # get the row index of that target data
      row_num = (target[target['hour'] == j].index)[0]
      # get the dwell time index of that target data
      dwell_idx = trip_start[i].index(j)
      #df.loc[rowIndex, 'New Column Title'] = "some value"
      new_sorted_anchored.loc[row_num, 'dwell_time'] = dwell_times[i][dwell_idx]
1
2
# Only keep one data
final_sorted_anchored = new_sorted_anchored[new_sorted_anchored['dwell_time'] > 0]
Now, we need another column that can tell our machine learning model that this is the dwell time data of the vessels when a typhoon happened. Let’s create a “typhoon” column that can indicate whether a typhoon happened at this time period or not.
1
2
final_sorted_anchored['typhoon'] = 0
final_sorted_anchored['typhoon'] = final_sorted_anchored['unixtime'].apply(lambda x: 1 if (x <= 1565459100 and x >= 1565372700) else 0)
Actually, we ran our machine learning model after this, but our models seemed like they were overfitting. Therefore, with advice from our advisor, we did a little bit more feature engineering.
Here what we’d tried after
Drop the data that has unusual dwell time
1
df = df.loc[df['dwell_time'] <= 600
We only wanted to care about “Cargo” and “Tanker” type of vessels. and to only get “Cargo” and “Tanker” vessels type, our data’s “vessel_type_code” should between 70 to 89.
1
   df = df[(df['vessel_type_code'] >= 70) & (df['vessel_type_code'] <= 89)
Add a new column that indicate number of ships in backlog at time of each ship’s first anchored ping
1
2
# sort pings by device_id and time
df = df.sort_values(by=['device_id', 'unixtime'], ascending=True)
1
2
3
4
5
6
7
8
9
10
11
12
13
14
# max time between pings to consider part of the same AOI visit
max_gap = 3600*6

# flag whether successive pings are from the same vessel
df['same_vessel'] = (df['device_id'].astype(int).diff() == 0)

# find time gap between pings
df['time_gap'] = (np.abs(df['unixtime'].astype(int).diff()) > max_gap)

# flag as new trip when time since previous ping is greater than max_gap (or previous ping is from a different vessel)
df['new_trip'] = (np.invert(df['same_vessel']) | df['time_gap'])

# add unique trip id
df['trip_id'] = df['new_trip'].cumsum()
1
2
3
4
5
# get first and last ping for each trip and it also require a ~0 cog (course-over-ground) to filter out the small subset of pings that erroneously report that the ship is ancored/moored while it is still moving
# by first filtering down to anchored/moored pings, then groupby trip_id with first/last agg
df_anchored = df[df['cog']<0.1]
first_anchored = df_anchored.groupby('trip_id').agg('first')
last_anchored = df_anchored.groupby('trip_id').agg('last')
1
2
3
# only fields we care about from last anchored pings are trip_id and unixtime
df_trips = pd.merge(first_anchored, last_anchored[['unixtime']], suffixes=('_first', '_last'), left_index=True, right_index=True)
df_trips.sort_values('unixtime_first', inplace=True)
1
2
3
4
5
 # calculate number of ships in backlog at time of each ship's first anchored ping
df_trips['new_trip'] = True
df_trips['cumulative_ships_arrived'] = df_trips.sort_values('unixtime_first')		['new_trip'].cumsum()
df_trips['cumulative_ships_departed'] = [len(df_trips[df_trips['unixtime_last']<=arrival]) for arrival in df_trips['unixtime_first'].values]
df_trips['n_ships_anchored'] = df_trips['cumulative_ships_arrived'] - df_trips['cumulative_ships_departed']
Model Selection and Evaluation
Model Selection Process
- Features:
- Vessel type code
- Latitude & Longtitude
- Typhoon Occurence
- Number of ships anchored
Some people might notice that we didn’t use “tonnage” as one of our features! It’s because we assumed that it might cause overfitting, so we just dropped it at the end!
- Label:
- Dwell Time
- Problem:
- Regression - Supervised learning problem where the label is real number
- Our Chosen Models:
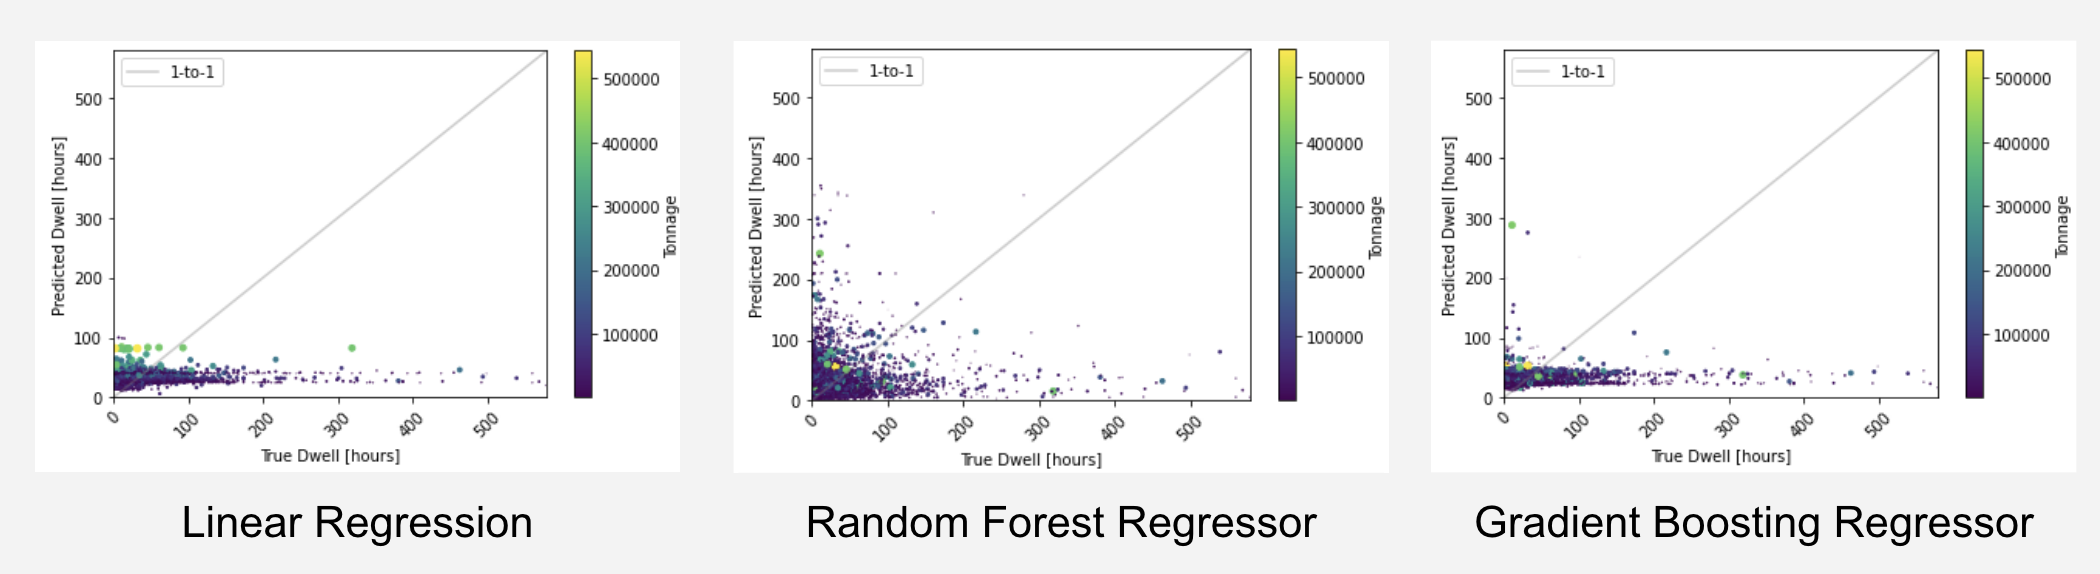
- Linear Regression
- Random Forest
- Gradient Boosting
Model Comparison
| Model Name | Description | Results | Pros | Cons |
|---|---|---|---|---|
| Linear regression | Model where straight line represents the data and proximity of points to line shows relationship between feature and label | Mean absolute error: 26.36 R^2: 0.01 | - Faster, more efficient, and simple - Overfitting can be reduced | - Prone to underfitting - Sensitive to outliers - Assumes data is independent |
| Random forest regressor | Regression model that involves multiple decision trees contained within one set and combined into an ensemble method | Mean absolute error: 29.55 R^2: -0.34 | - High accuracy - Easy data preparation - Can handle larger data | - Biased towards more complex variables - Little control over the model |
| Gradient boosting regressor | Iterative model that progressively refines its predictions by combining multiple decision trees | Mean absolute error: 26.34 R^2: 0.00 | - Generally more accurate compare to other models - Lots of flexibility | - Prone to overfitting - Hard to interpret the final models |
Model Visualization
Insights and Key Findings
- Final Model Selection
- Gradient Boosting Regressor
- Why? Lowest mean absolute error (only by a negligible amount)
- Gradient Boosting Regressor
- Mean Absolute Error is very high
- Overfitted Model
- Features may not lead to accurate predictions
- Potential Solutions
- Spend more tinkering with features
- Try using different and more datasets
- Potentially look at approaching as classification problem
Final Thought
Trial and Error
Lessons Learned:
- How to decide our reasonable thesis and scale of our project
- How to deal with AIS dataDeeper understanding of python libraries (Numpy, Pandas, Scikit-Learn) & ML tools (Google Colab)
- How important the data preparation process is
- How to format the data to be suitable for our Machine Learning model
- Why correct understanding of input and output feature is important
- How to work as a teamImportance of understanding the business/economic impact of our project
Takeaways:
- Exposure to a new side of machine learning
- Gaining hands on experience for Python in a quick-paced learning environment
- To not be afraid to ask questions!
Obstacles & Potential Next Steps
Obstacles:
- Scheduling a time when we are all available
- Limited in-person meetings
- Beginner knowledge in Python
- New exposure to machine learning and data science
- Never done any industrial scale project before
- Geospatial data vs clean data
Next Steps:
- Scale up to different region or different typhoon
- Apply this model to other natural disaster
- Apply this model to different transportation such as truck, airplane, train, and so on
- Focus on a specific company? (Amazon, Ebay, etc)